The following is just a lame excuse for generating some graphs, scanning a process' heap, and answering the question: "What does the heap look like?"
The table below provides data and visualizations of the heap layout of various programs. These programs were not recompiled, and the C standard library (libc) (which provides malloc()) is GNU glibc version 2.16. The glibc on the machine conducting the tests was provided by Arch Linux. The data was gathered on November 26, 2012.
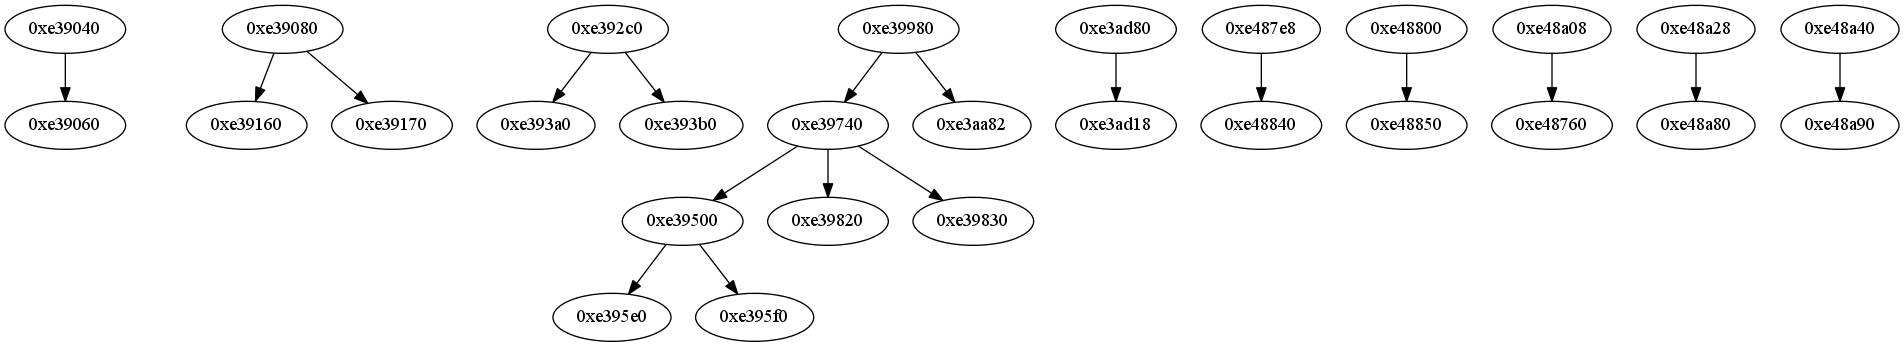
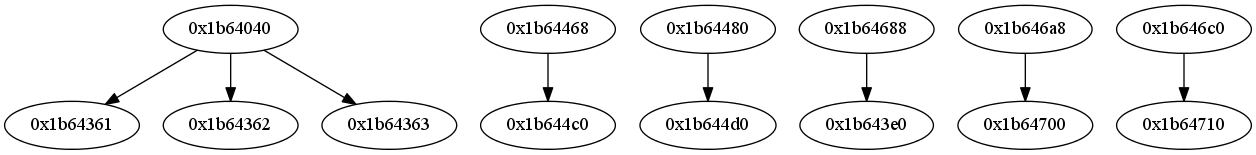
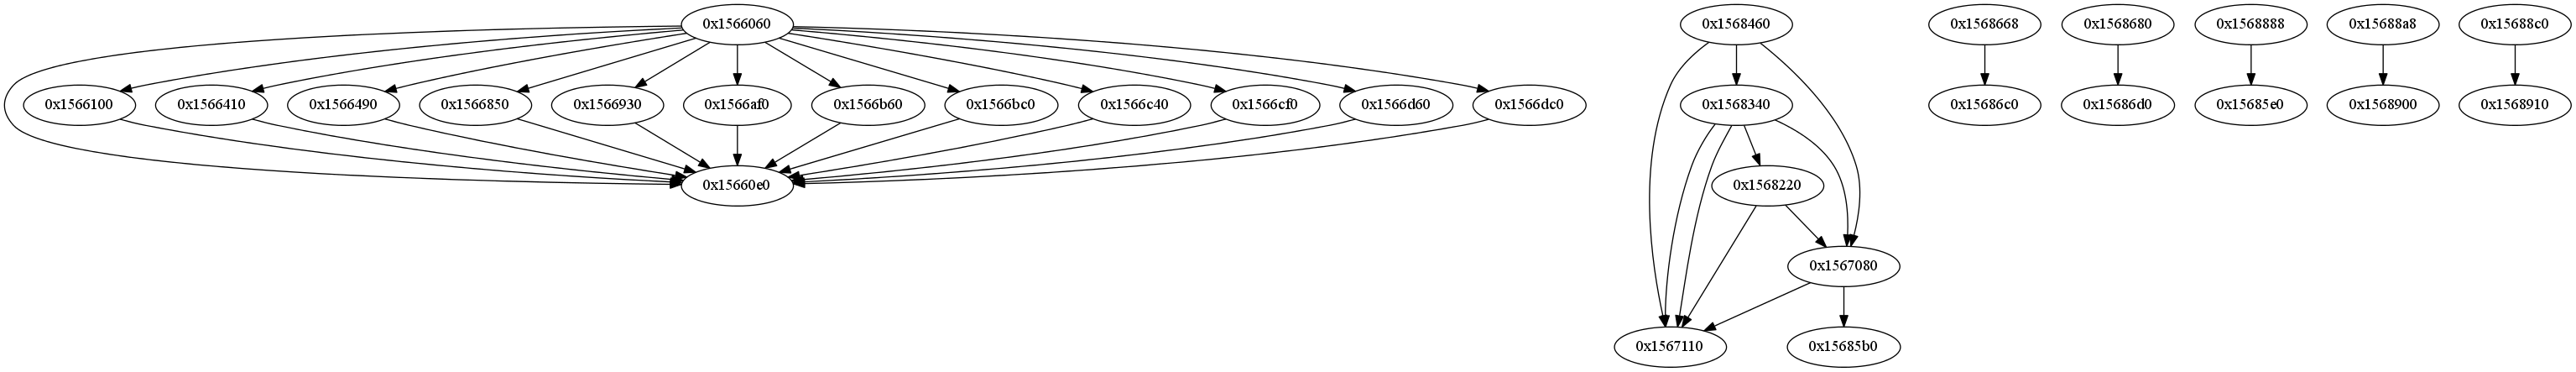
The heap scanner works by starting at the beginning of the heap segment and working its way towards the end of the heap. Each value (assuming word-size alignment on 64-bit boundaries) is looked at. The value is first converted to an address. If that value/address resides inside the heap segment, then the heap scanner ouputs the data to the data file (sniff_scan1.log). The data output says that the address contains a pointer to data.
To generate the plots the malloc() data in the sniff.log and the who-points-to-who data in sniff_scan1.log are compared. The result of this comparison is a .dot file, which is used to build the .svg and .png images. This comparison is simple, each heap address output from the scaner (sniff_scan1.log) is matched to a malloc() in the sniff.log. If the address is not a match, it is still output. Either way, the address contains data that looks like a heap address. The result is a .dot depicting which address points to the which other address.
Why didn't I implement feature-x?
I was bored and wanted to write a heap scanner
and generate graphs. This is an approximation of the heap layout, nothing
scientific, just some fun and such.
| Command | Data | malloc() Calls | Notes |
| bzip2 pg2591.txt | [svg |png |gexf |data] | 11 | 537K Grimm's Fairy Tales |
| bunzip2 pg2591.txt.bz2 | [svg |png |gexf |data] | 9 | 141K Grimm's Fairy Tales (compressed) |
| hostname | [svg |png |gexf |data] | 2 | |
| ls -la | [svg |png |gexf |data] | 2111 | 13 files and directories |
| mkdir foo_dir | [svg |png |gexf |data] | 30 | |
| rmdir foo_dir | [svg |png |gexf |data] | 30 | |
| touch me | [svg |png |gexf |data] | 30 | |
| rm me | [svg |png |gexf |data] | 36 | |
| ps aux | [svg |png |gexf |data] | 2408 | Around 152 processes |
| who | [svg |png |gexf |data] | 1851 | 1 sexxy user (me) |